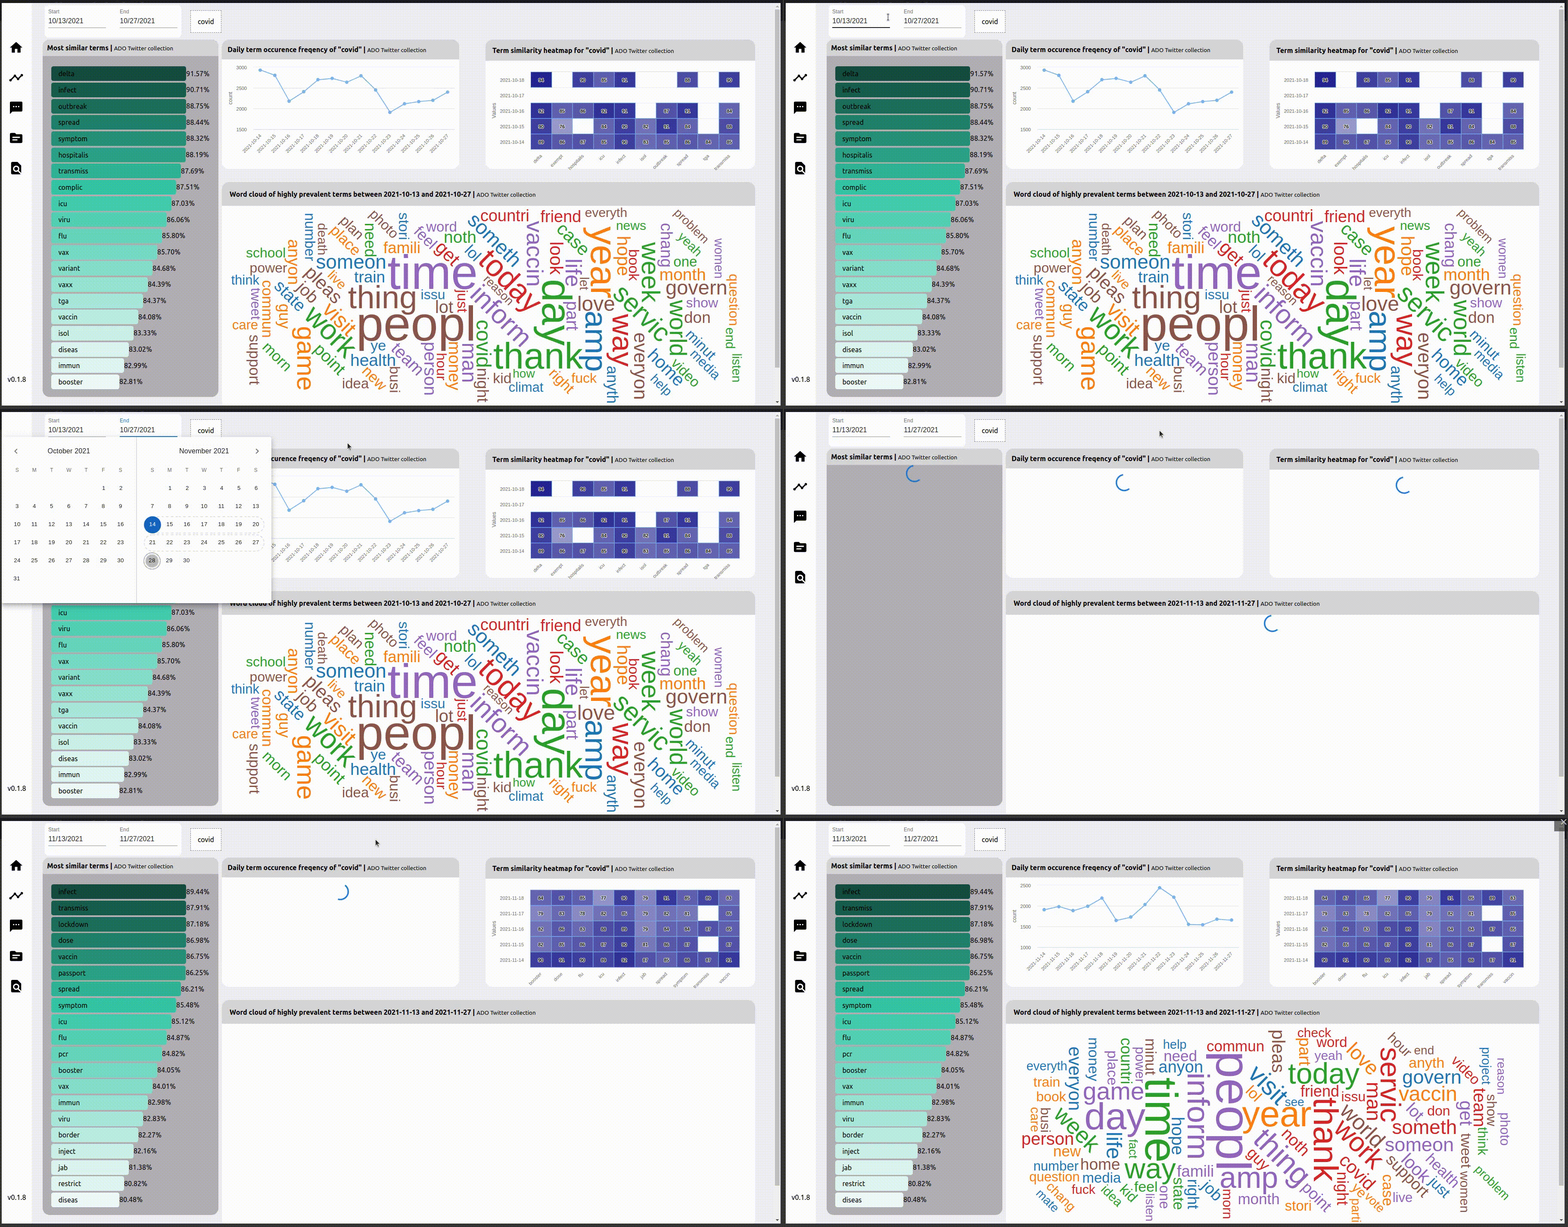
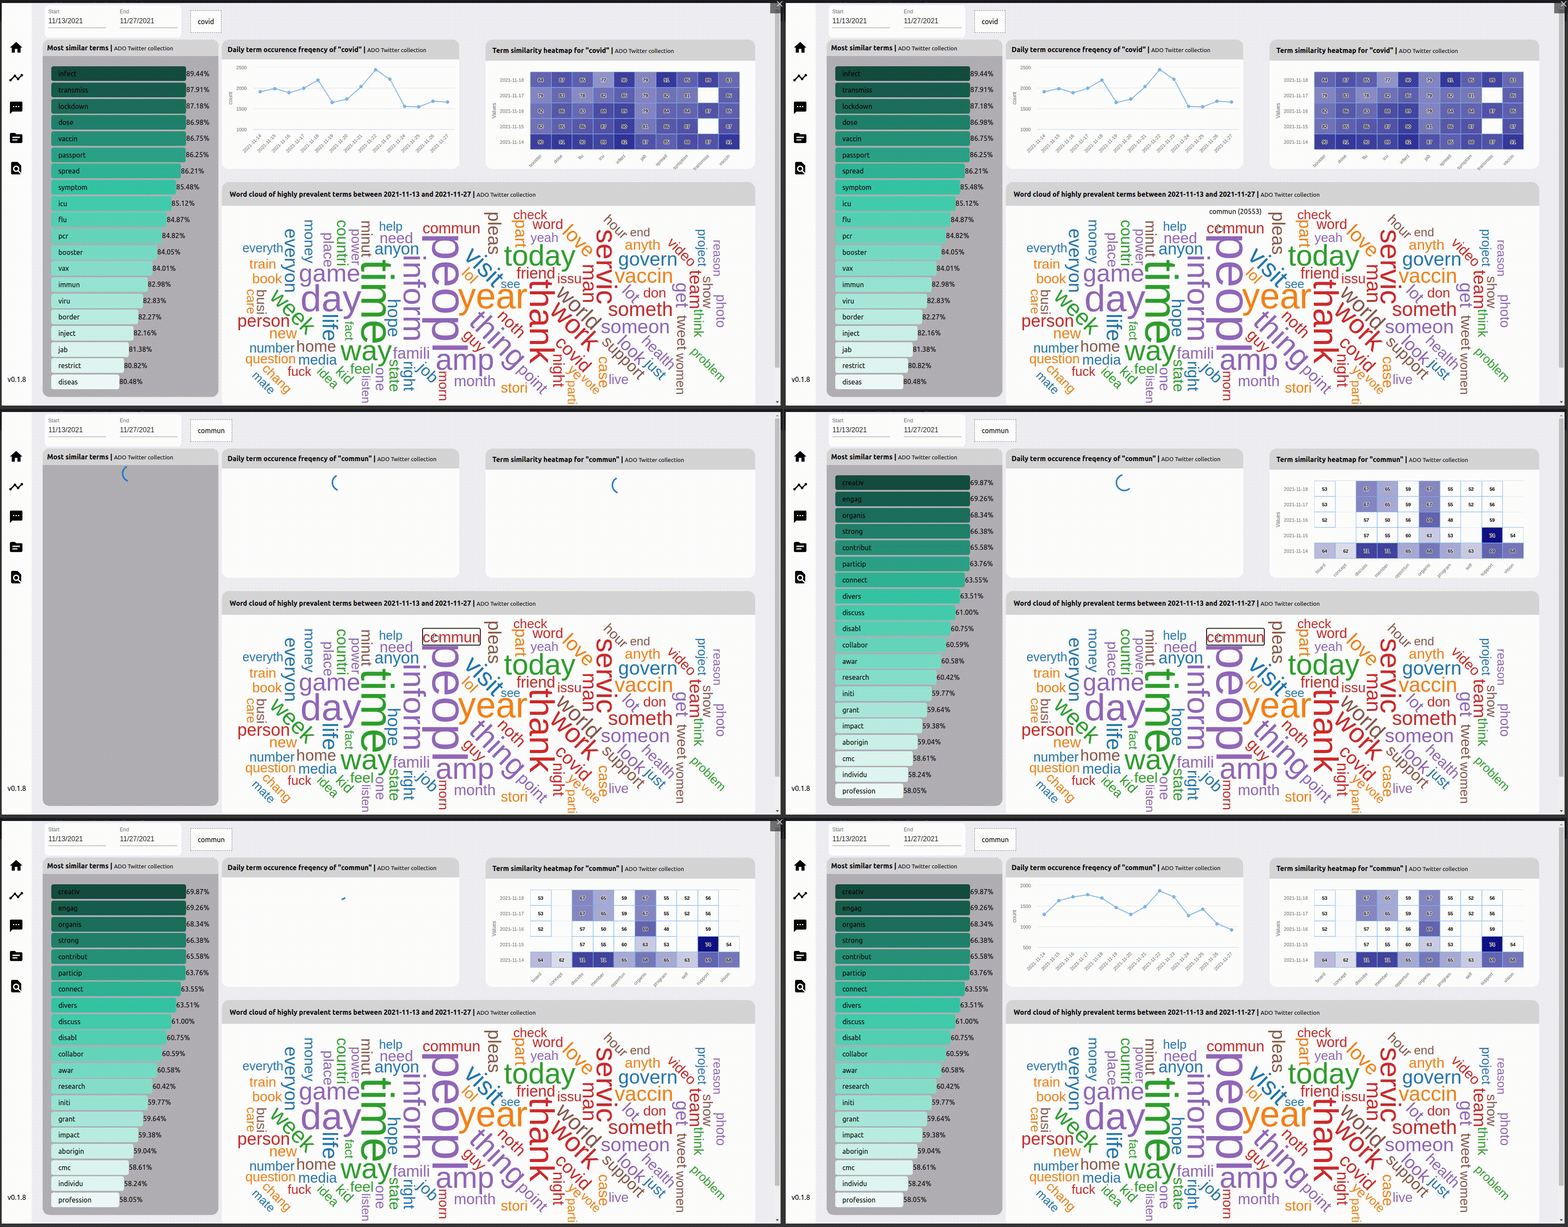
Two outputs of the ADO Topic Modelling pipeline (which is run daily, on a days worth of social media data) are the frequency of terms, as well as the development of word embeddings for the day. The ADO-API grants the ability to analyze the term frequency data, as well as interact with the word embedding models. The ADOReD Term analysis tab interacts with the API to visualize the outputs, and examine the semantic relationships between words in a certain time period.
Word embeddings – encoding words into vectors
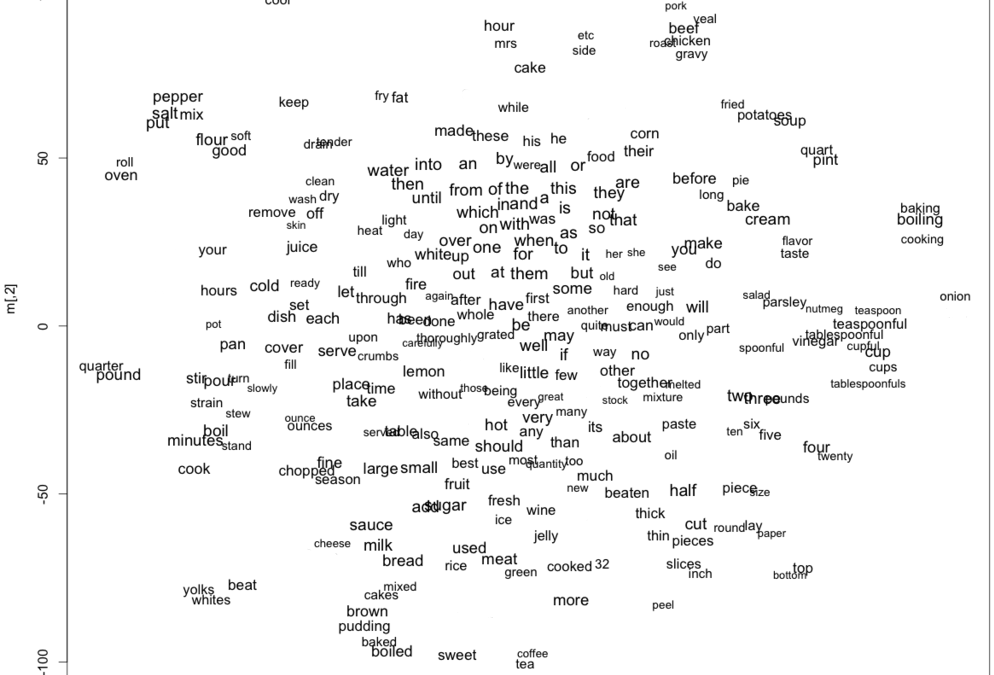
Word embeddings are representations of words in a numerical manner, such as n-dimensional vectors. They can be used to capture the semantic and syntactic properties of words, and similarities vectors of two words correlate with the words’ semantic similarity. A common example is:
W("woman")−W("man") ≃ W("queen")−W("king")
where subtracting the vector of the word man from woman, would have a cosine distance close to the distance between the word queen minus the word king. In the pipeline, word2vec was used to build these word embeddings for all the terms in the vocabulary derived from the corpus, as well as the word embedding space. The ADO-API provides an interface to interact with these models by querying with terms and days of interest, and responding with a payload of the top 20 most similar terms – derived from the nearest words in the embedding space.

Term Analysis
The term analysis tab loads a number of widgets which are controlled by the date range, and focus word parameters. Changing the date range triggers a change across all widgets.

The word cloud in the bottom right is generated from the frequency statistics of the words, with the size of the word proportional to the frequency of the term. This wordcloud is interactive, so a word on the word cloud can be clicked on to change the focus word. This results in changing the visualizations in the other three widgets for the focus word.

The widget on the left is the result of a summation of cosine similarity of similar terms, in the period specified in the date range. This can be useful as a mechanism to gauge public perception about certain themes, at certain periods of time, based on examining the closest, or most similar, words of interest. The terms are then further sorted on this measure to build the visualisation.