Some steps in this tutorial require Python, versions 3.8 and greater, to be installed along with the python packages requests, matplotlib and wordcloud.
The Twitter API contains an endpoint which allows authorized users (details on how to attain access is listed here) to attain variety of information about the Tweet specified by the requested tweet ID or list of tweet IDs. There are a number of ways in which an interesting list of tweet ids may be attained, one of which is via the topic graph on ADOReD, or from source of data.
Get a cluster Id
For instance, for a certain period of time, there may be a topic cluster that appears interesting to the user. Hovering over the node in the graph will display the id of the cluster of choice, e.g. 20220503-1 along with other metadata about the topic cluster.
This cluster contains some interesting top terms such as: “abort”, “court”, “birth”, “draft” – possibly suggesting that the theme is related to the US Supreme Court vote to overturn a landmark ruling on abortion.
The topic id can be used for a POST request made to the ADO-API endpoint,
POST /analysis/nlp/collections/{collection}/topicposts Collect tweet ids using the ADO-API
With the cluster ID, requesting the tweet ids from the ADO-API can be done by the following steps in Python:
import requests
from requests.auth import HTTPBasicAuth

# user to pass their api key as a string
API_KEY = <key string>

# authentication step
url = "https://api.ado.eresearch.unimelb.edu.au/login"
res = requests.post(url, auth=HTTPBasicAuth('apikey', API_KEY))
if res.ok:
   jwt = res.text

# pass jwt to headers
headers = {'Authorization': f"Bearer {jwt}"}

# list of cluster ids in the array, add or remove according to
# clusters of interest
data = ["20220503-1"]

url =
res = requests.post(url, headers = headers, json=data, timeout=20)
result = res.json()

# the list of tweet ids
print(result)
['1116230652200984576', '1151989861265526784', '1207646162813100033', '1243158979431153664', '1304391637746036736', '1367677320249630722', '1395815539210084355', '1419313775992360962', '1466818620005228544', '1467515496979476486' .... ]
Query the Twitter API
Once an array of these tweet ids has been attained from the ADO-API, it is now ready to be used to query the Twitter API. The following steps shown below:
NOTE: The API key and API keysecret have to be attained after access has been approved for the Twitter API.
data = {
    'grant_type': 'client_credentials',
}

API_KEY=<enter api key>
API_KEY_SECRET=<enter api key secret>

# obtain bearer token for api access
response = requests.post('https://api.twitter.com/oauth2/token', data=data, auth=(f"{API_KEY}", f"{API_KEY_SECRET}"))
bearer_token = response.json()["access_token"]
# pass bearer to headers
headers = {'Authorization': f"Bearer {bearer_token}"}

# get twitter docs from api, requesting 100 tweets at a time
# split result array into chunks of 100 comma seperated strings
tweetIds = [",".join(result[i:i + 100]) for i in range(0, len(result), 100)]
data = []
params = {
'tweet.fields':'geo,conversation_id,created_at,lang,author_id,context_annotations,entities,public_metrics',
'place.fields': 'geo,full_name,id,country,country_code',
'user.fields' : 'location'
 }
for tweets in tweetIds:
    params['ids'] = tweets
    response = requests.get("https://api.twitter.com/2/tweets", params=params, headers=headers)
    data += [ payload for payload in response.json()['data'] ]
The data array contains all of the tweets have been harvested from the Twitter API. The tweets can be processed and analyzed in a variety of ways once in this format.
Analysis of tweets: Top hashtags
One interesting area of analysis would be to aggregate the hashtags contained in the subset of these tweets, and visualize the frequency of each respective hashtag. This is demonstrated in the block below:
import collections
from wordcloud import WordCloud
import matplotlib.pyplot as plt

def tagExtract(tw):
    return tw['tag']

# collect list of hashtags
hashtags = []

for tweet in data:
    if 'entities' in tweet.keys() and 'hashtags' in tweet['entities'].keys():
       hashtags += list(map(tagExtract,tweet['entities']['hashtags']))

# generate wordcloud from hashtags to visualize data
text = " ".join(hashtag for hashtag in hashtags)
word_cloud = WordCloud(collocations = False, background_color = 'white').generate(text)
plt.imshow(word_cloud2, interpolation='bilinear')
plt.axis("off")
plt.show()
The block above produces the following wordcloud:
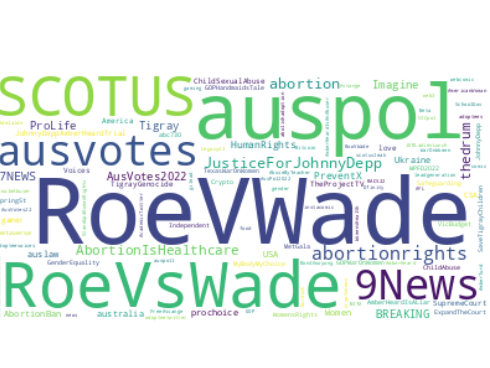
The precise frequencies of hashtags, sorted with descending frequency, can also be viewed with the following block:
elements_counts = collections.Counter(hashtags)
elements_counts
Counter({'RoeVWade': 79, 'auspol': 46, 'RoeVsWade': 33, 'SCOTUS': 25, '9News': 19, 'abortionrights': 16, 'ausvotes': 14, 'JusticeForJohnnyDepp': 14, 'abortion': 13, '7NEWS': 9, 'AbortionIsHealthcare': 8, 'thedrum': 8, 'AusVotes2022': 7, 'Imagine': 7, 'Tigray': 7, 'PreventX': 6, 'Women': 5, 'AbortionBan': 5, 'auslaw': 5, 'ProLife': 5, 'Voices': 4, 'JohnnyDeppAmberHeardTrial': 4, 'CSA': 4, 'ChildSexualAbuse': 4, 'love': 4, 'Ukraine': 4, 'HumanRights': 4, 'scotus': 4, 'BREAKING': 4, 'AusPol': 4, 'USA': 4, 'AusVotes': 4, 'TheProjectTV': 4, 'TheDrum': 4, 'TigrayGenocide': 4, 'abc730': 3, 'JohnnyDepp': 3, 'WPFD2022': 3, 'ChildAbuse': 3, 'Safeguarding': 3, 'australia': 3, 'MetGala': 3, 'TexasWarOnWomen': 3, 'GOPWarOnWomen': 3, 'WomensRights': 3, 'Breaking': 3, 'abortionishealthcare': 3, 'MyBodyMyChoice': 3, 'SupremeCourt': 3, 'ExpandTheCourt': 3, ...})
Further analysis areas
With the raw twitter data on hand, there are many other types of analysis that could be performed. The tweets could be ranked by public metrics (retweets, likes, replies and quoted), mapped (those tweets which are geolocated) or the tweet text data could be analyzed for sentiment (see this). Deeper comparsions between tweet clusters are also possible, which could provide some useful insights.